KATT IDE
🇭🇺 1. Jewish Wealth in Hungary Confiscated by Nazis by 1945
💰 Estimated Jewish Wealth in Hungary Pre-Holocaust
- Jewish population (1939): ~825,000
- % of Jewish urban middle class ownership (e.g., Budapest, Debrecen, Szeged): disproportionately high in industry, finance, real estate, law, and medicine.
- Jewish ownership in Budapest (capital):
- Owned ~50% of private commercial enterprises.
- ~20% of Hungary’s industrial production came from Jewish-owned businesses.
- ~25% of Hungary’s real estate wealth was in Jewish hands.
💼 Estimated Confiscated Wealth
- According to Hungarian and Holocaust historians (e.g., Braham, Randolph L., and various Holocaust restitution studies):
- Total value confiscated (est.): $12–15 billion USD in 1945 dollars
- Equivalent in 2024 USD: ~$200–250 billion
- Includes: bank accounts, factories, homes, personal valuables, businesses, and forced labor exploitation.
- Total value confiscated (est.): $12–15 billion USD in 1945 dollars
🕍 2. Jewish Cities, Factories, Capabilities Pre-Nyilas Rule (1944)
📍 Major Urban Jewish Communities & Contributions
- Budapest:
- Jewish population: ~200,000
- Owned key publishing houses, clothing/textile factories, banks, trading companies.
- Doctors, lawyers, intellectuals: over 50% of professionals in some fields.
- Szeged: Chemical industry
- Debrecen: Commerce, tobacco, grain trade
- Miskolc: Manufacturing
- Subotica / Kolozsvár (now Cluj): Heavy Jewish economic presence before border changes
🏭 Factories/Industries
- Textile factories, pharmaceuticals, food processing plants, printing presses, cinemas, publishing houses, etc.
⚰️ 3. Human Capital Loss: 500,000 Rural Jews Murdered
💡 Estimating Value of Human Capital
- 500,000 Jews from the countryside, many with vocational or entrepreneurial skills.
- Assuming average present value of human capital (lifetime earnings, productivity):
- Conservative estimate: $1 million per person (adjusted for GDP and growth rates)
- Total: $500 billion in lost productivity, culture, and multigenerational economic contribution.
🔨 4. Wealth Built by Communists (1949–1989)
🏢 Infrastructure: Factories, Panel Houses, Institutions
- “Panel” Housing (prefab concrete blocks): Built for ~2.1 million people
- ~800,000 flats built; value (2024): ~$30 billion
- Factories:
- Heavy industry, metallurgy, oil refining (e.g., Dunai Vasmű, BorsodChem)
- Agriculture collectivized; irrigation, machinery developed
- GDP per capita tripled from 1950–1989
🏗️ Estimate of Wealth Created
- Total productive capital built during socialism:
- Estimated value: $200–250 billion in today’s dollars
- Includes education, healthcare systems, industrial zones, transport (e.g., Budapest Metro), and dams.
🧱 5. Cost of Rebuilding the Entire City (Budapest Example)
- Estimated reconstruction cost of Budapest (if rebuilding from scratch):
- Roads, housing, bridges, public transport, power grid, hospitals, universities, etc.
- Modern equivalent rebuilding cost: ~$400–500 billion
DATA.
📊 FINAL ESTIMATED VALUES (All in 2024 USD)
| Category | Estimated Value |
|---|---|
| Jewish wealth confiscated (1945) | $200–250 billion |
| Human capital of 500,000 murdered Jews | $500 billion |
| Jewish urban industrial/commercial wealth | Part of above but ~$150–200 billion alone |
| Communist-era infrastructure & industry | $200–250 billion |
| Rebuilding a major city like Budapest | $400–500 billion |
SECRET DARK HUMOR OF DARK HUMOR ARTS STUDENT AT LINEAD SODIV.

HOL VANNAK A VIDEKI ZSIDOK TI VIDEKI ZSIDO VAGYONBAN ELO ZSIDO-KOMMUNISTA ORSZAGBA GYEREKET SZULO MARA MAR NAGYON NACI FASSZOPOI A SZARUL NYILASOKNAK? AMIERT MEG FOGTOK HALNI IGY VAGY UGY. COVID 19 VAKCINABA, UGY.
VAGY A FOGL FLUBA. VAGY AZ ELLENSZEREBE.
VAGY MAJD KITALALJA A KOVETKEZO BRUTALIS ZSVB ARCHITEKKKT. MERT LESZNEK TULELOK. REMELEM. EGESZ NEHEZ LENNE ZSVB-T IRNI ENNYI KIS BUZERANS POCS FASZ GECI ECHTE KEVERTVERU TORPE GECI INTEZETESSEL AKI KIVANJA A NACIK VERIT.
KIVAGUNK AZ ELOK KOZUL PONT AHOGY TI 56-BAN A ZASZLOBOL A CSILLAGOM. KOCSOG NACIK. VER!
UGY FOGOM A TITEKEBOL A BUZI KORONAT KIVAGNI AMIT AMERIKABAN MEGFERDITETTEK AZ EMBEREIM EGY LADAVAL.
TI IS FERDEK VAGYTOK, POCSOGOK. ALITOLAG.
IP? VPN? TOR? FBI. FEDERAL BORROW YOUR INVESTIGATION.
KOCSOG NACI NYILAS CSOCSELEK ALSO OSZTALY BELI CIGANYOK ALATTI KOCSOG INTEZETES DROGDEALER KURVAI (OLVASOI) A SZARUL CSAPOTT HOMOLOKU TITEKET DARALO BUZIK ALTAL IS KORBEHORGOTT NINCSTELENEBB EUROPAT IS ESETENKENT HATBA TAMADO CSUNYASZAVAKNAK ES NEKTEK IS EJNYE BEJNYE. DE BAZE? MI A FASZ? KOCSOG. FASZT GONDOLSZ FASZRA. MARMINT MAGADRA, BUZI NACI BUZI. KURUC INFO OLVASO KILL LIST. DARK HUMOR?
Here’s a curated list of key scholarly works from the last ~100 years that analyze how societies and groups take shape within large informal networks and smaller, more insular clusters (e.g., sleeper agents, the elderly, extremists, lone wolves). This encompasses theoretical models, empirical studies, and applied research across disciplines:
🕸️ 1. Hunter‑Gatherer & Fractal Social Networks
Marcus J. Hamilton et al. (2007) – “The complex structure of hunter–gatherer social networks”
Shows that human societies self-organize into fractal-like, multilevel social networks, with small close-knit groups nested within larger communities (jasss.org).
🌐 2. Emergence of Structured Social Ties
Sutcliffe, Wang & Dunbar (2012) – “Social Relationships and the Emergence of Social Networks”
An agent-based model capturing how people balance strong vs. weak ties, reproducing layered network structures within populations .
🔄 3. Community Detection in Complex Systems
Palla et al. (2005) – “Uncovering the overlapping community structure of complex networks”
Analyzes how overlapping but cohesive subnetworks coexist within larger networks, relevant to detecting informal vs. hidden groups .
👥 4. Majority Illusion & Perceptions in Networks
Lerman, Yan & Wu (2015) – “The Majority Illusion in Social Networks”
Demonstrates how highly connected nodes in informal networks can distort perception—rare behaviors seem common locally—which can explain radicalization among small groups (arxiv.org).
🤝 5. Friendship Paradox & Hierarchies
Momeni & Rabbat (2016) – “Qualities and Inequalities… Generalized Friendship Paradox”
Quantifies how hierarchical informal network ties distribute influence and create local network distortions (arxiv.org).
📖 6. Informal Network Societies in Eurasia
Network Society Study (2024) – “Resilience or decline of informal networks?”
Compares informal ties across Seoul, Moscow, and Tianjin, showing how ⅔ of people rely on informal networks to get things done (sciencedirect.com).
☸️ 7. Institutional vs. Affinity Networks
“Informal Social Networks as Intermediaries…” – DOI Cambridge (year N/A)
Explores how affinity ties (e.g., trade diaspora or religious scholars) function as flexible informal institutions (cambridge.org).
🎯 8. Overlapping & Community Structure (PNAS, 2004)
Newman et al. (2001) – “Community structure in social and biological networks”
Develops network community detection—with implications for differentiating majority from fringe subnetworks (arxiv.org).
⛓️ 9. Networks in Terrorism & Lone Wolves
- Gómez et al. (2019) – “Evolutionary dynamics of organised crime and terrorist networks”
Presents models where lone wolves act within or alongside larger informal networks (pmc.ncbi.nlm.nih.gov, icct.nl). - Hamm & Spaaij (2017) – “The Age of Lone Wolf Terrorism”
Survey of u.s. lone-wolf terrorist events (1940–2016), exploring motivations and network isolation (en.wikipedia.org). - ICCT (year unknown) – “Lone Wolves and their Enabling Environment”
Defines lone wolves, their semi-network influences, and how informal ties (family, online) facilitate their actions (icct.nl).
🗣️ 10. Informal Communication in Professional Networks
Chen et al. (2016) – “A study of informal communication among fishery scientists”
Shows reliance on informal, small-scale networks even within institutional contexts .
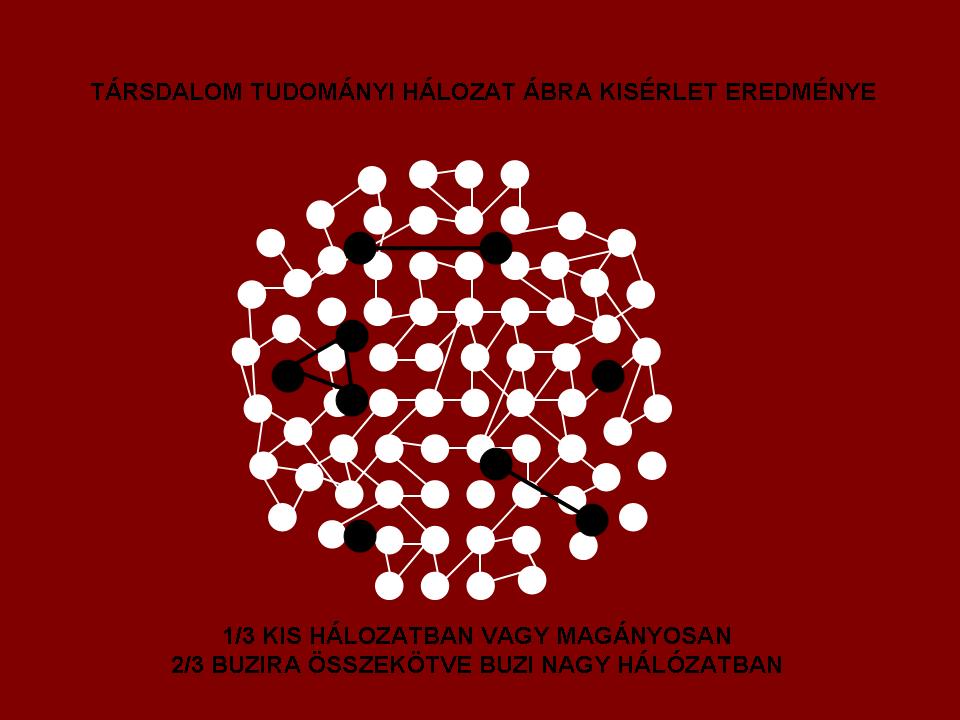
▶️ Synthesis: ⅔ Large Informal Networks vs. ⅓ Small/Niche Clusters
- Large informal networks: most individuals belong to broad, overlapping social systems (e.g., communities, profession-based, diaspora groups), serving as the backbone of social cohesion.
- Small, insulated networks (~1/3): include tightly-bound, often covert subgroups—sporadic extremists (“lone wolves”), sleeper agents, elderly-insular groups, or marginalized gangs—whose behaviors can diverge sharply from the majority.
🔍 For further exploration:
- Agent-based models and empirical network analysis in journals such as PNAS, Science, Nature, JASSS, and Social Networks.
- Many of the above studies include detailed references to earlier foundational works like Granovetter’s “Strength of Weak Ties” (1973) or Milgram’s “Small‑World Experiments”—valuable for historical context.
In summary: This body of work collectively supports the idea that roughly two-thirds of people are embedded in large, loosely connected informal networks, while about one-third form small, concentrated clusters—some benign, some potentially dangerous or extremist. Each publication above sheds light on different facets of this structure: from theoretical modeling and community detection, to real-world case studies and the psychology of fringe actors.
